Annual Report 2009
Reporting period
The site was started 7.12.2002, from 13.01.2003 it switched to a permanent mode of operation. We present our report for the period 1.01.2009 – 31.12.2009. Against quantitative indicators in parentheses are submitted data from 2008.
Site size
Due to the gradual change from static HTML and introduction of new technologies the site size calculated conditionally:
| Date | Number of files | Size, MB |
| 31/12/2009 | 5888 | 126.5 |
| 31/12/2008 | 4326 | 79.7 |
Site visits
The root page of the site was visited by 23000 readers (as shows the counter at the root page). Average it is 63 visits per day. During the previous year – 19855 / 54.
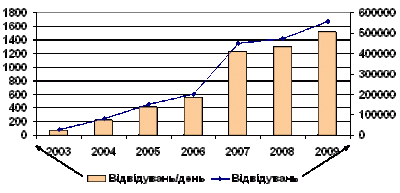
The total visits count was 556 367 (473 144), or almost 24 times more (visit we consider a series of document requests from the same IP-address during a calendar day). Average it is 1524.3 (1296.2) visits per day. This ratio means that the majority of readers fall directly to the requested documents, avoiding the root page of the site.
Site visited by 256181 (196611) hosts (unique IP-addresses).
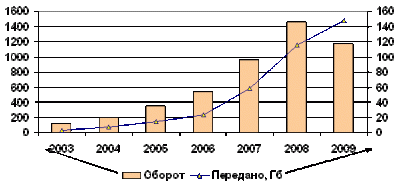
Site process 13.2 (8.8) million files requests, or 36 thousand (24 thousand) files per day. This resulted in a total volume of 148 (116) GB of data transferred, or 405 (317) MB per day.
Site efficiency was calculated as number of HTML documents requested by a visitor. It equaled this year as 2.91 (3).
Our success
Site dynamics for 2003 – 2009 (on the left axis: visits per day; on the right axis: total visits).
From this chart one can see that overall in 2009 can be considered as a significant increase, but to acheve 1 million visits per year we still need work.
Dynamics of volumes for 2003 – 2009 (on th left axis: turnover; on the right axis: year traffic, Gb)
The turnover of the site on this diagram was calculated as total annual traffic divided by the site size. So it shows how many times by year entire site was readed.
Site availability
The site of all time worked in a mode 24 hours / 7 days a week. For a quality hosting special thanks to a " company, which provides hosting our site.
Site dynamics
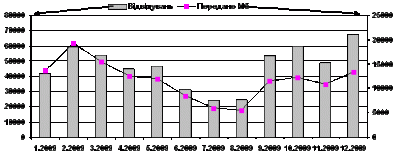
General site dynamics (monthly data for 2009)
Compare this chart with similar charts for previous years shows that the dramatic decline in summer traffic, which so frightened us in 2008, exactly repeated in 2009. Simple explanation is that most of our readers are pupils and students who have summer vacation. This implies a decline in November and in 2009 (in schools and universities has been quarantined because of influenza epidemic).
Download
Recall that our site was created for promotion of programs developed by us – a universal hierarchical database "Myslene drevo"; its free distribution is available for downloading from the site. Therefore, success in downloading our distributions we pleased.
| File | downloading | |
| in 2009 | Total | |
| Myslene drevo 3.0 installation | 179 | 179 |
| Myslene drevo 2.2 source code | 33 | 403 |
10 most popular documents on the site
| Document | Requests | |
| 2009 | 2008 | |
| Lesja Ukrainka | 40988 | 40063 |
| Lesja Ukrainka: Poems | 31360 | 15384 |
| Lesja Ukrainka: works | 22156 | 13130 |
| Kamenets | 15821 | 1616 |
| Search Results | 14543 | 14245 |
| Lesja Ukrainka: photos | 13600 | 12767 |
| Lesja Ukrainka: gallery | 11227 | 14488 |
| Lesja Ukrainka: On the wings of song | 8967 | 4560 |
Ctrl + Enter!
In 2007 we introduced online computer game Ctrl + Enter, encouraging readers point us to typographical errors in our documents. In 2009, the game continued. In 2009 we obtain 549 (449) comments, 72 (170) of which considered appropriate (by which made the correction) and 477 (279) – false. It does not take into account those errors that we noticed and fixed independently, without participation of readers. Percentage of valid observations – 13% (38%). In general, should recognize that the computer game improves the quality of the texts of the site.
Available in ukrainian version only.
We welcome all of our authors with success and invite them and other scientists to publish their works on our site If you have any suggestions – mail to us.


